Excel to Power BI
Tittle: Analysis of Top Uk Youtubers
Table of contents
- Objective
- Data source
- User story
- Stages
- Design
- Design mockup
- Tools
- Development
- Pseudocode
- Data exploration
- Data cleaning
- Transform the Data
- Create the SQL View
- Testing
- Visualization
- Results
- Dax measures
- Analysis
- Findings
- Validation
- Discovery
- Recommendations
- Potential ROI
- Actions plan
- Conclusion
Objective
- What is the key main point?
The Head of Marketing wants to find out who the top YouTubers are in 2024 to decide on which YouTubers would be best fit to run marketing campaigns throughout the rest of the year.
- What is the ideal solution?
To create a dashboard that provides insights into the top UK YouTubers in 2024 that includes their
- subscriber count
- total views
- total videos
This will help the marketing team make informed decisions about which YouTubers is best fit to collaborate with in the upcoming marketing campaigns.
User story
As the Head of Marketing, I want to use a dashboard that analyses YouTube channel data in the UK.
This dashboard should allow me to identify the top performing channels based on metrics like subscriber base and average views.
With this information, I can make more informed decisions about which Youtubers are right to collaborate with, and therefore maximize how effective each marketing campaign is.
Data source
- What data is needed to achieve this objective?
We need data on the top UK YouTubers in 2024 that includes their
- channel names
- total subscribers
- total views
-
total videos uploaded
- Where is the data coming from? The data is sourced from Kaggle (an Excel extract), https://www.kaggle.com/datasets/bhavyadhingra00020/top-100-social-media-influencers-2024-countrywise?resource=download
Stages
- Design
- Developement
- Testing
- Analysis
Design
Dashboard components required
- What should the dashboard contain based on the requirements provided?
To understand what it should contain, we need to figure out what questions we need the dashboard to answer:
- Who are the top 10 YouTubers with the most subscribers?
- Which 3 channels have uploaded the most videos?
- Which 3 channels have the most views?
- Which 3 channels have the highest average views per video?
- Which 3 channels have the highest views per subscriber ratio?
- Which 3 channels have the highest subscriber engagement rate per video uploaded?
For now, these are some of the questions we need to answer, this may change as we progress down our analysis.
Design mockup
- What should it look like?
Some of the data visuals that may be appropriate in answering our questions include:
- Table
- Treemap
- Scorecards
- Bar chart
Tools
| Tool | Purpose |
|---|---|
| Excel | Exploring the data |
| SQL Server | Cleaning, testing, and analyzing the data |
| Power BI | Visualizing the data via interactive dashboards |
| GitHub | Hosting the project documentation and version control |
| Mokkup | AI Designing the wireframe/mockup of the dashboard |
Development
Pseudocode
- What’s the general approach in creating this solution from start to finish?
- Get the data
- Explore the data in Excel
- Load the data into SQL Server
- Clean the data with SQL
- Test the data with SQL
- Visualize the data in Power BI
- Generate the findings based on the insights
- Write the documentation + commentary
- Publish the data to GitHub Pages
Data exploration
This is the stage where you have a scan of what’s in the data, errors, inconcsistencies, bugs, weird and corrupted characters etc
- What are your initial observations with this dataset? What’s caught your attention so far?
- There are at least 4 columns that contain the data we need for this analysis, which signals we have everything we need from the file without needing to contact the client for any more data.
- The first column contains the channel ID with what appears to be channel IDS, which are separated by a @ symbol - we need to extract the channel names from this.
- Some of the cells and header names are in a different language - we need to confirm if these columns are needed, and if so, we need to address them.
- We have more data than we need, so some of these columns would need to be removed
Data cleaning
- What do we expect the clean data to look like?
- What should it contain?
- What limitations should we apply to it?
The aim is to refine our dataset to ensure it is structured and ready for analysis.
The cleaned data should meet the following criteria and constraints:
- Only relevant columns should be retained.
- All data types should be appropriate for the contents of each column.
- No column should contain null values, indicating complete data for all records.
Below is a table outlining the constraints on our cleaned dataset:
| Property | Description |
|---|---|
| Number of Rows | 100 |
| Number of Columns | 4 |
And here is a tabular representation of the expected schema for the clean data:
| Column Name | Data Type | Nullable |
|---|---|---|
| channel_name | VARCHAR | NO |
| total_subscribers | INTEGER | NO |
| total_views | INTEGER | NO |
| total_videos | INTEGER | NO |
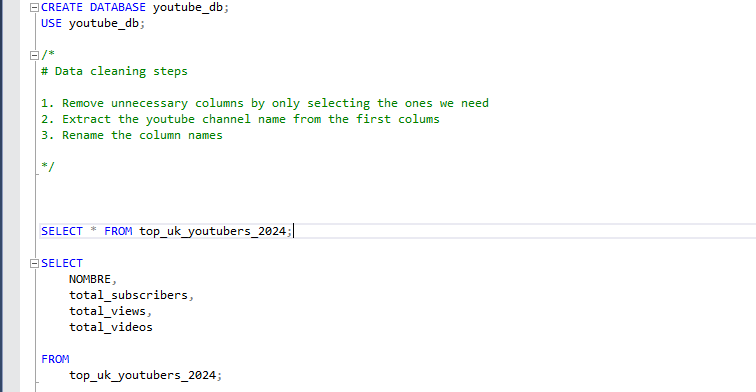
- What steps are needed to clean and shape the data into the desired format?
- Remove unnecessary columns by only selecting the ones you need.
- Extract Youtube channel names from the first column.
- Rename columns using aliases.
Transform the data
/*
# 1. Select the required columns
# 2. Extract the channel name from the 'NOMBRE' column
*/

-- 1.
SELECT
    SUBSTRING(NOMBRE, 1, CHARINDEX('@', NOMBRE) -1) AS channel_name,
    total_subscribers,
    total_views,
    total_videos

FROM
    top_uk_youtubers_2024
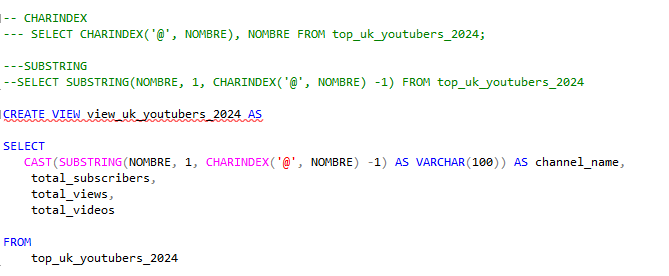
Create the SQL view
/*
# 1. Create a view to store the transformed data
# 2. Cast the extracted channel name as VARCHAR(100)
# 3. Select the required columns from the top_uk_youtubers_2024 SQL table
*/

-- 1.
CREATE VIEW view_uk_youtubers_2024 AS

-- 2.
SELECT
    CAST(SUBSTRING(NOMBRE, 1, CHARINDEX('@', NOMBRE) -1) AS VARCHAR(100)) AS channel_name,
    total_subscribers,
    total_views,
    total_videos

-- 3.
FROM
    top_uk_youtubers_2024
Testing
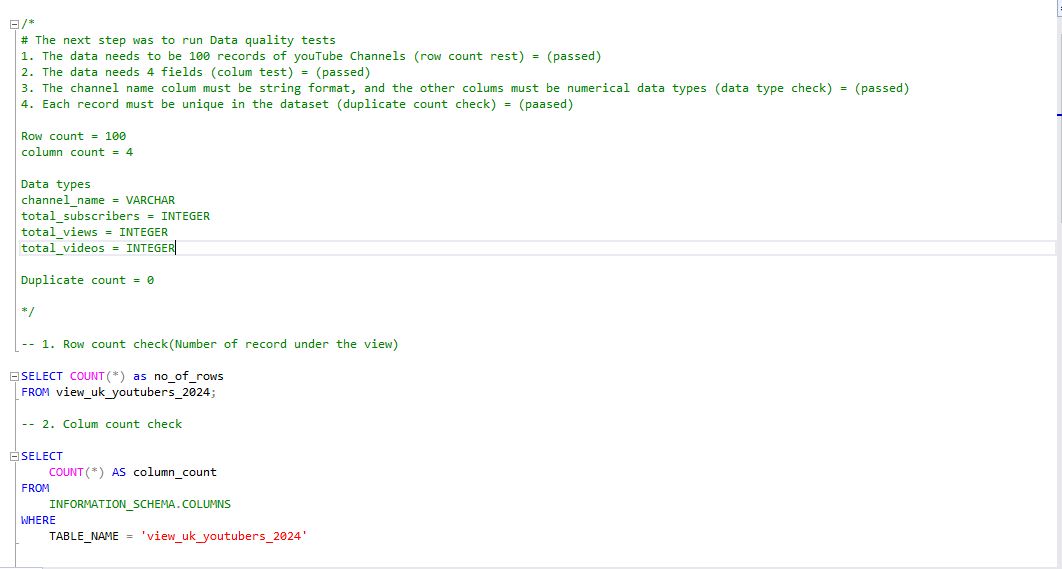
- What data quality and validation checks are you going to create? Here are the data quality tests conducted:
Row count check & Column count check
/*
# Count the total number of records (or rows) are in the SQL view
*/

SELECT
    COUNT(*) AS no_of_rows
FROM
    view_uk_youtubers_2024;
/*
# Count the total number of columns (or fields) are in the SQL view
*/


SELECT
    COUNT(*) AS column_count
FROM
    INFORMATION_SCHEMA.COLUMNS
WHERE
    TABLE_NAME = 'view_uk_youtubers_2024'
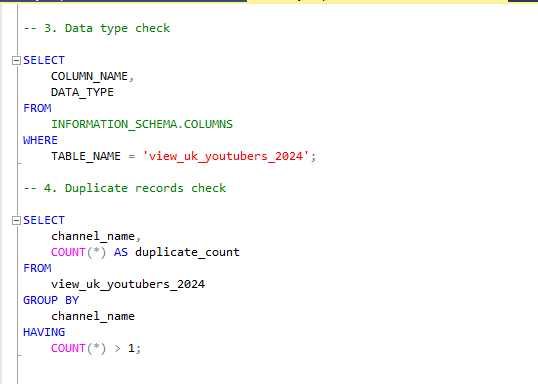
Data type check & Duplicate count check
/*
# Check the data types of each column from the view by checking the INFORMATION SCHEMA view
*/

-- 1.
SELECT
    COLUMN_NAME,
    DATA_TYPE
FROM
    INFORMATION_SCHEMA.COLUMNS
WHERE
    TABLE_NAME = 'view_uk_youtubers_2024';
/*
# 1. Check for duplicate rows in the view
# 2. Group by the channel name
# 3. Filter for groups with more than one row
*/

-- 1.
SELECT
    channel_name,
    COUNT(*) AS duplicate_count
FROM
    view_uk_youtubers_2024

-- 2.
GROUP BY
    channel_name

-- 3.
HAVING
    COUNT(*) > 1;
Visualization
Results
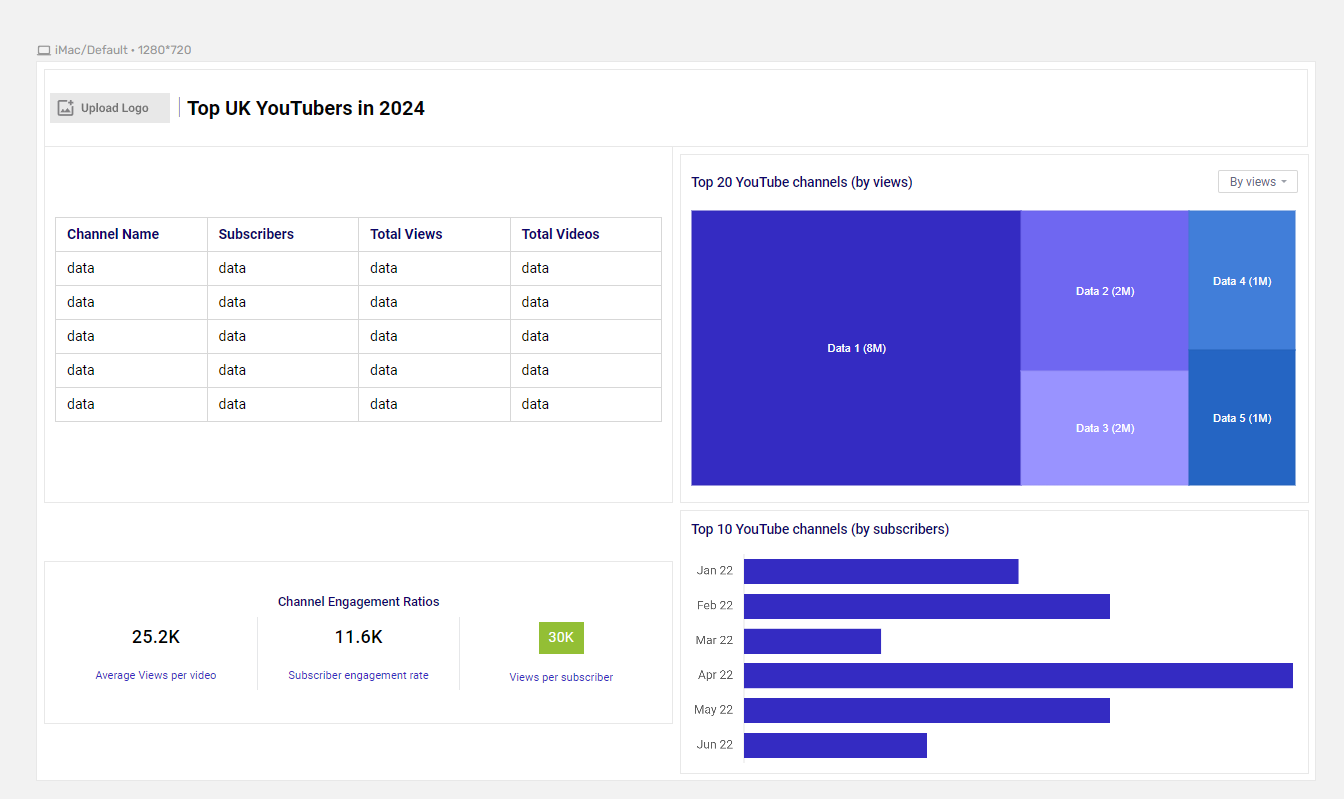
- What does the dashboard look like?
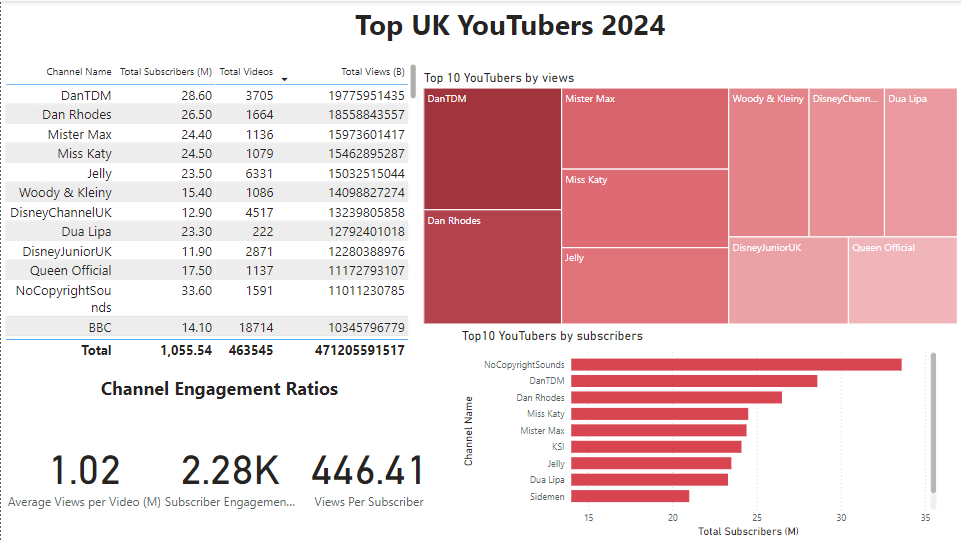 This shows the Top UK Youtubers in 2024 so far.
Dax measures
- Total Subscribers (M) ```powerbi Total Subscribers (M) = VAR million = 1000000 VAR sumOfSubscribers = SUM(view_uk_youtubers_2024[total_subscribers]) VAR totalSubscribers = DIVIDE(sumOfSubscribers,million)
RETURN totalSubscribers
2. Total Views (B)
```powerbi
Total Views (B) =
VAR billion = 1000000000
VAR sumOfTotalViews = SUM(view_uk_youtubers_2024[total_views])
VAR totalViews = ROUND(sumOfTotalViews / billion, 2)

RETURN totalViews
- Total Videos ```powerbi Total Videos = VAR totalVideos = SUM(view_uk_youtubers_2024[total_videos])
RETURN totalVideos
4. Average Views Per Video (M)
```powerbi
Average Views per Video (M) =
VAR sumOfTotalViews = SUM(view_uk_youtubers_2024[total_views])
VAR sumOfTotalVideos = SUM(view_uk_youtubers_2024[total_videos])
VAR  avgViewsPerVideo = DIVIDE(sumOfTotalViews,sumOfTotalVideos, BLANK())
VAR finalAvgViewsPerVideo = DIVIDE(avgViewsPerVideo, 1000000, BLANK())

RETURN finalAvgViewsPerVideo
- Subscriber Engagement Rate ```powerbi Subscriber Engagement Rate = VAR sumOfTotalSubscribers = SUM(view_uk_youtubers_2024[total_subscribers]) VAR sumOfTotalVideos = SUM(view_uk_youtubers_2024[total_videos]) VAR subscriberEngRate = DIVIDE(sumOfTotalSubscribers, sumOfTotalVideos, BLANK())
RETURN subscriberEngRate
6. Views per subscriber
```powerbi
Views Per Subscriber =
VAR sumOfTotalViews = SUM(view_uk_youtubers_2024[total_views])
VAR sumOfTotalSubscribers = SUM(view_uk_youtubers_2024[total_subscribers])
VAR viewsPerSubscriber = DIVIDE(sumOfTotalViews, sumOfTotalSubscribers, BLANK())

RETURN viewsPerSubscriber
Analysis
Findings
- What did we find? For this analysis, we’re going to focus on the questions below to get the information we need for our marketing client -
Here are the key questions we need to answer for our marketing client:
- Who are the top 10 YouTubers with the most subscribers?
- Which 3 channels have uploaded the most videos?
- Which 3 channels have the most views?
- Which 3 channels have the highest average views per video?
- Which 3 channels have the highest views per subscriber ratio?
- Which 3 channels have the highest subscriber engagement rate per video uploaded?
1. Who are the top 10 YouTubers with the most subscribers?
| Rank | Channel Name | Subscribers (M) |
|---|---|---|
| 1 | NoCopyrightSounds | 33.60 |
| 2 | DanTDM | 28.60 |
| 3 | Dan Rhodes | 26.50 |
| 4 | Miss Katy | 24.50 |
| 5 | Mister Max | 24.40 |
| 6 | KSI | 24.10 |
| 7 | Jelly | 23.50 |
| 8 | Dua Lipa | 23.30 |
| 9 | Sidemen | 21.00 |
| 10 | Ali-A | 18.90 |
2. Which 3 channels have uploaded the most videos?
| Rank | Channel Name | Videos Uploaded |
|---|---|---|
| 1 | GRM Daily | 14,696 |
| 2 | Manchester City | 8,248 |
| 3 | Yogscast | 6,435 |
3. Which 3 channels have the most views?
| Rank | Channel Name | Total Views (B) |
|---|---|---|
| 1 | DanTDM | 19.78 |
| 2 | Dan Rhodes | 18.56 |
| 3 | Mister Max | 15.97 |
4. Which 3 channels have the highest average views per video?
| Channel Name | Averge Views per Video (M) |
|---|---|
| Mark Ronson | 32.27 |
| Jessie | J 5.97 |
| Dua Lipa | 5.76 |
5. Which 3 channels have the highest views per subscriber ratio?
| Rank | Channel Name | Views per Subscriber |
|---|---|---|
| 1 | GRM Daily | 1185.79 |
| 2 | Nickelodeon | 1061.04 |
| 3 | Disney Junior UK | 1031.97 |
6. Which 3 channels have the highest subscriber engagement rate per video uploaded?
| Rank | Channel Name | Subscriber Engagement Rate |
|---|---|---|
| 1 | Mark Ronson | 343,000 |
| 2 | Jessie J | 110,416.67 |
| 3 | Dua Lipa | 104,954.95 |
Notes
For this analysis, we’ll prioritize analysing the metrics that are important in generating the expected ROI for our marketing client, which are the YouTube channels with the most
- subscribers
- total views
- videos uploaded
Validation
1. Youtubers with the most subscribers
Calculation breakdown
Campaign idea = product placement
a. NoCopyrightSounds
- Average views per video = 6.92 million
- Product cost = $5
- Potential units sold per video = 6.92 million x 2% conversion rate = 138,400 units sold
- Potential revenue per video = 138,400 x $5 = $692,000
- Campaign cost (one-time fee) = $50,000
- Net profit = $692,000 - $50,000 = $642,000
b. Dan TDM
- Average views per video = 5.34 million
- Product cost = $5
- Potential units sold per video = 5.34 million x 2% conversion rate = 106,800 units sold
- Potential revenue per video = 106,800 x $5 = $534,000
- Campaign cost (one-time fee) = $50,000
- Net profit = $534,000 - $50,000 = $484,000
c. Dan Rhodes
- Average views per video = 11.15 million
- Product cost = $5
- Potential units sold per video = 11.15 million x 2% conversion rate = 223,000 units sold
- Potential revenue per video = 223,000 x $5 = $1,115,000
- Campaign cost (one-time fee) = $50,000
- Net profit = $1,115,000 - $50,000 = $1,065,000
Best option from category: Dan Rhodes
2. Youtubers with the most videos uploaded
Calculation breakdown
Campaign idea = sponsored video series
a. GRM Daily
- Average views per video = 510,000
- Product cost = $5
- Potential units sold per video = 510,000 x 2% conversion rate = 10,200 units sold
- Potential revenue per video = 10,200 x $5= $51,000
- Campaign cost (11-videos @ $5,000 each) = $55,000
- Net profit = $51,000 - $55,000 = -$4,000 (potential loss)
b. Manchester City
- Average views per video = 240,000
- Product cost = $5
- Potential units sold per video = 240,000 x 2% conversion rate = 4,800 units sold
- Potential revenue per video = 4,800 x $5= $24,000
- Campaign cost (11-videos @ $5,000 each) = $55,000
- Net profit = $24,000 - $55,000 = -$31,000 (potential loss)
c. Yogscast
- Average views per video = 710,000
- Product cost = $5
- Potential units sold per video = 710,000 x 2% conversion rate = 14,200 units sold
- Potential revenue per video = 14,200 x $5= $71,000
- Campaign cost (11-videos @ $5,000 each) = $55,000
- Net profit = $71,000 - $55,000 = $16,000 (profit)
Best option from category: Yogscast
3. Youtubers with the most views
Calculation breakdown
Campaign idea = Influencer marketing
a. DanTDM
- Average views per video = 5.34 million
- Product cost = $5
- Potential units sold per video = 5.34 million x 2% conversion rate = 106,800 units sold
- Potential revenue per video = 106,800 x $5 = $534,000
- Campaign cost (3-month contract) = $130,000
- Net profit = $534,000 - $130,000 = $404,000
b. Dan Rhodes
- Average views per video = 11.15 million
- Product cost = $5
- Potential units sold per video = 11.15 million x 2% conversion rate = 223,000 units sold
- Potential revenue per video = 223,000 x $5 = $1,115,000
- Campaign cost (3-month contract) = $130,000
- Net profit = $1,115,000 - $130,000 = $985,000
c. Mister Max
- Average views per video = 14.06 million
- Product cost = $5
- Potential units sold per video = 14.06 million x 2% conversion rate = 281,200 units sold
- Potential revenue per video = 281,200 x $5 = $1,406,000
- Campaign cost (3-month contract) = $130,000
- Net profit = $1,406,000 - $130,000 = $1,276,000
Best option from category: Mister Max
Discovery
- What did we learn?
We discovered that
- NoCopyrightSOunds, Dan Rhodes and DanTDM are the channnels with the most subscribers in the UK.
- GRM Daily, Man City and Yogscast are the channels with the most videos uploaded.
- DanTDM, Dan RHodes and Mister Max are the channels with the most views.
- Entertainment channels are useful for broader reach, as the channels posting consistently on their platforms and generating the most engagement are focus on entertainment and music.
Recommendations
- What do you recommend based on the insights gathered?
- Dan Rhodes is the best YouTube channel to collaborate with if we want to maximize visbility because this channel has the most YouTube subscribers in the UK.
- Although GRM Daily, Man City and Yogcasts are regular publishers on YouTube, it may be worth considering whether collaborating with them with the current budget caps are worth the effort, as the potential return on investments is significantly lower compared to the other channels.
- Mister Max is the best YouTuber to collaborate with if we’re interested in maximizing reach, but collaborating with DanTDM and Dan Rhodes may be better long-term options, considering the fact that they both have large subscriber bases and are averaging significantly high number of views.
- The top 3 channels to form collaborations with are NoCopyrightSounds, DanTDM and Dan Rhodes based on this analysis, because they attract the most engagement on their channels consistently.
Potential ROI
- What ROI do we expect if we take this course of action?
- Setting up a collaboration deal with Dan Rhodes would make the client a net profit of $1,065,000 per video.
- If we go with a product placement campaign with DanTDM, this could generate the client approximately $484,000 per video.
- NoCopyrightSounds could profit the client $642,000 per video too (which is worth considering).
Actions plan
- What action plan should we take and why?
Based on our analysis, we beieve the best channel to advance a long-term partnership deal with to promote the client’s products is the Dan Rhodes channel.
We’ll have conversations with the marketing client to forecast what they also expect from this collaboration. Once we observe we’re hitting the expected milestones, we’ll advance with potential partnerships with DanTDM, Mister Max and NoCopyrightSounds channels in the future.
- What steps do we take to implement the recommended decisions effectively?
- Reach out to the teams behind each of these channels, starting with Dan Rhodes.
- Negotiate contracts within the budgets allocated to each marketing campaign.
- Kick off the campaigns and track each of their performances.
- Review how the campaigns have gone, gather insights and optimize based on feedback from converted customers and each channel’s audiences.
Conclusion
Base on the findings and analysis of the viewership and views per subscriber, Dan Rhodes appears to be the best option to advance with due to higher returns of investment compared to other channels. Hence the conclusion was that the head of marketing, will work with Dan Rhodes to run it`s current marketing campaing throughout the rest of the year as per the analysis.